
Last year I wrote about the idea of a personal dashboard and earlier this year I described my 2020 goals and how I’d go about measuring my progress. The past two days I was able to combine the two concepts and created a simple Grafana dashboard to measure my progress against the blogging goal. As with most tasks, the most difficult part was getting started and the actual exercise took a few hours. While it’s still fresh in my mind I want to document the step by step process in order to both provide a perspective into how I work while also giving others a guide to setting up their own.
- Decide on the Grafana backend. I already committed to Grafana as the visualization layer but needed to decide on the actual statistics backend. This isn’t that important of a decision and I can change it any time so I just chose MySQL. I have a personal instance of MySQL floating around (who doesn’t?), am not going to be dumping much data into it, and am comfortable writing SQL queries.
- Set up MySQL. I already had a MySQL instance up so this required setting up a new database and the appropriate users. Note that I needed to create a master user for adding the data as well as a read-only user that Grafana uses for querying.
CREATE USER 'stats_user'@'%' IDENTIFIED BY 'XYZ'; GRANT SELECT,INSERT,UPDATE,DELETE,CREATE,DROP,ALTER,INDEX,CREATE TEMPORARY TABLES,CREATE VIEW,SHOW VIEW ON stats.* TO 'stats_user'@'%'; CREATE USER 'stats_read'@'%' IDENTIFIED BY 'ABC'; GRANT SELECT ON stats.* TO 'stats_read'@'%'; - Determine the MySQL schema. Since I know both the unit I want to analyze (blog post) and the metric I care about the schema practically writes itself. At first I chose date, title, and a few of the fields but tweaked this after the subsequent step.
create table blog_post ( ymd date not null, slug varchar(200) not null, title varchar(200) not null, keywords varchar(1000) not null, description varchar(1000) not null, tags varchar(200) not null, num_chars int not null, num_text_words int not null, num_text_description int not null, num_keywords int not null, num_tags int not null, num_images int not null, num_links int not null, unique key (ymd, slug) ); - Get the data into MySQL. Lucky for me I already had an old blog analysis script that took my blog, cleaned up all the posts, and dumped the contents to a CSV. I had to make a few tweaks to the script to allow me to specify the exact fields to write out but after that was done I had a CSV file that could be imported to MySQL. I had a few options for how to get this data into MySQL including modifying the above script to connect to MySQL but instead decided that using a manual
LOAD DATAcommand would suffice for now. Out of all the steps this one took the longest time - especially figuring out the right syntax for theLOAD DATAcommand.LOAD DATA LOCAL INFILE '/home/dan/code/blog-analytics/out.csv' REPLACE INTO TABLE blog_post FIELDS TERMINATED BY ',' ENCLOSED BY '"' ESCAPED BY '"' LINES TERMINATED BY '\n' IGNORE 1 LINES (title,tags,keywords,description,num_chars,num_text_words,num_text_description,num_keywords,num_tags,num_images,num_links,ymd,slug); - Connect Grafana to MySQL. Grafana worked right out of the box after installation with
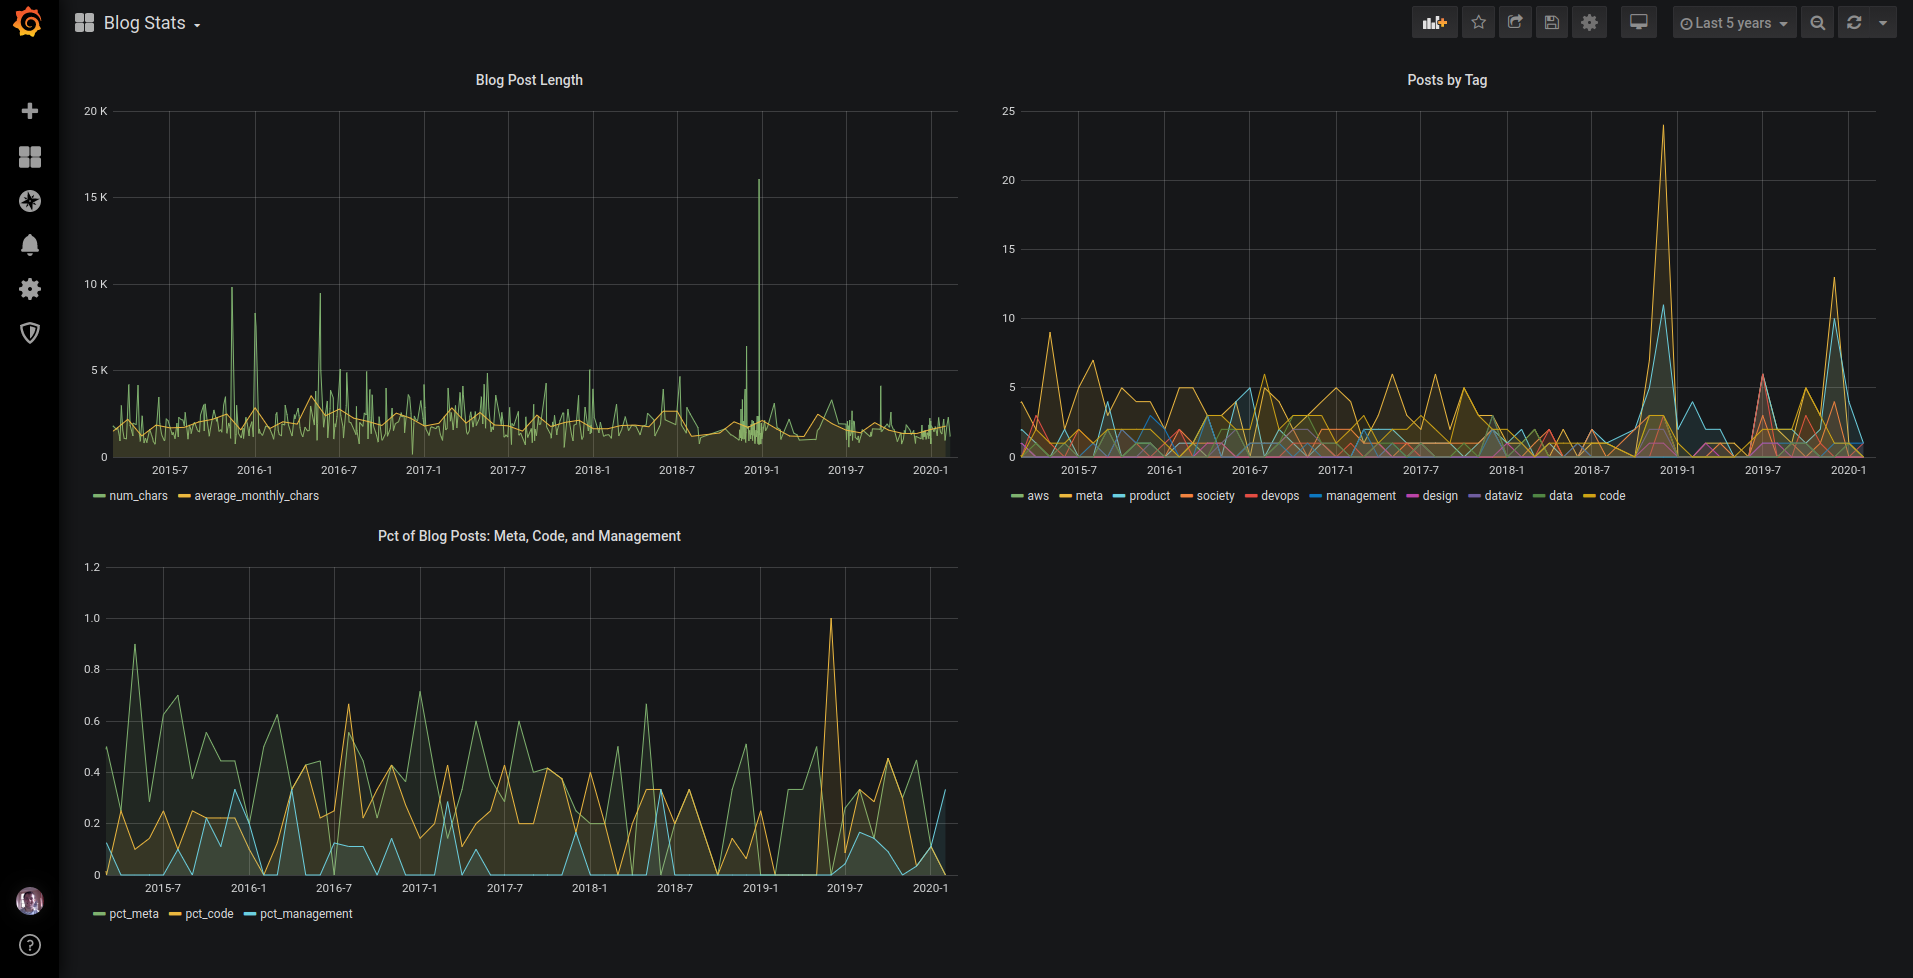
apt getbut I had to create a read-only user as Grafana refused to use a user that had write access. - Create a few dashboards. Now came the fun part. I started by trying to use Grafana’s query builder took but quickly resorted to just writing the SQL manually. The nuance here was having to convert the MySQL date field into a UNIX timestamp that worked with Grafana.
SELECT UNIX_TIMESTAMP(ymd) AS "time", num_chars FROM blog_post ORDER BY UNIX_TIMESTAMP(ymd); SELECT UNIX_TIMESTAMP(date_format(ymd, '%Y-%m-01')) AS "time", avg(num_chars) as average_monthly_chars FROM blog_post GROUP BY time ORDER BY time - Clean up the deployment. By default, Grafana runs on port 3000 and I wanted to serve it on a standard port behind HTTPS. This required installing nginx (via
apt get), using it to create a simple reverse proxy, and then using Let’s Encrypt to add SSL. At this point I also gave this a unique Grafana subdomain.server { server_name xyz.abc; location / { proxy_pass http://localhost:3000/; } listen [::]:443 ssl ipv6only=on; # managed by Certbot listen 443 ssl; # managed by Certbot ssl_certificate /etc/letsencrypt/live/xyz.abc/fullchain.pem; # managed by Certbot ssl_certificate_key /etc/letsencrypt/live/xyz.abc/privkey.pem; # managed by Certbot include /etc/letsencrypt/options-ssl-nginx.conf; # managed by Certbot ssl_dhparam /etc/letsencrypt/ssl-dhparams.pem; # managed by Certbot }
The solution is far from perfect - for example if the instance hosting Grafana goes down I’d have to repeat the bulk of the above steps. At the same time, that’s a risk I’m currently willing to take, especially since the process itself was so quick and I’m manually saving down the JSON behind the dashboard.