Earlier this week we scaled up our Kafka cluster to take advantage of more availability zones and increase the replication for some of our key topics. After making sure the new brokers joined the existing cluster we needed to redo the partitioning to take advantage of these newly available brokers.
I’m sure there are better and more modern tools out there but we’ve been using SiftScience’s kafka-assigner. Rather than being a naive partitioning it looks at the existing assignments and optimizes the new assignment to minimize the number of moves while striving to keep the partitions evenly distributed across all brokers.
The script is simple to run - you give it the topic and the desired replication factor and it generates the new partition assignments via JSON that can then be passed into Kafka’s built in partition reassignment tool.
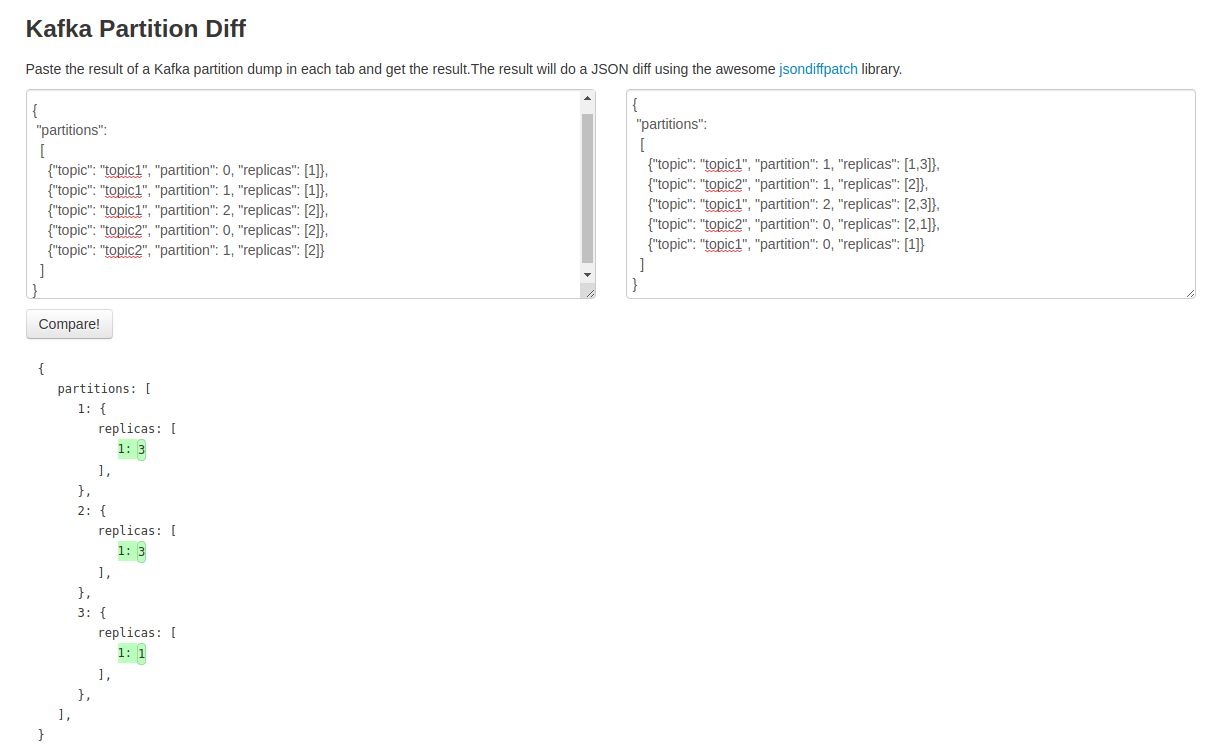
As part of our testing we wanted to verify that the new assignments made sense by quickly looking at the differences but the task was made difficult since the original assignment was printed in a random order. This made a standard diff difficult to do so I ended up building a small tool to sort the JSON and then visualize the differences.
The code is up on GitHub and the tool is available at https://dangoldin.github.io/js-tools/#tab-kafka-partition-diff. It’s not the fanciest but is a simple solution to a simple problem. I wish the tool itself did a better job of highlighting the differences but that’s another project.