
Last year I came up with a set of scripts to analyze my blog and thought it would be interesting to rerun them this year to see what’s changed. There are a ton of visualizations up on GitHub but most are just a fun visual without actually telling a story. I’ve included the most important ones below with a bit of analysis and commentary. It also looks as if the charts are getting too messy for multiple years of data so I’ll need to revisit the visualizations for 2019.
You can clearly see how behind I am and how aggressive I've been over the past 2 months. Definitely do not want to repeat this in 2019.
Previous years indicate that I've primarily been writing on weekends but this year you see a nice even distribution across every day of the week. Unfortunately this is just a function of me trying to catch up and writing multiple posts a day.
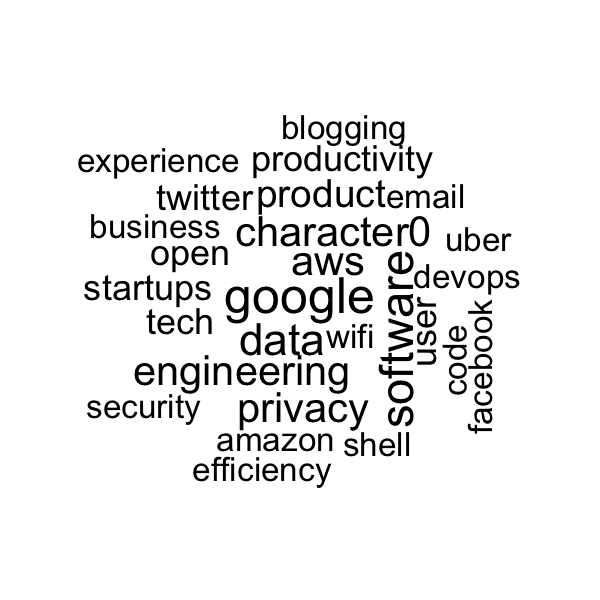
Word clouds do a nice job of surfacing the key topics and themes and this year there was a lot of posts about the large tech companies. Next year I want to write less about the tech companies and more about technology itself.