Lately I’ve been doing a variety of quick data investigations and they typically follow the same formula: write a query to fetch some simple data, copy and paste into Excel, do a minimal amount of manipulation, plot the results. Often this happens in a sequence where the results of one analysis leads to another one and so forth and so forth until the data has been sliced so many different ways that I’m able to figure out what I was investigating.
Earlier today I did yet another one of these analysis and got annoyed by how repetitive the process was and wrote a quick script to handle simplest case: a single line chart derived from two columns - each representing an axis. The script works by taking tab delimited data via stdin and then using matplotlib to do a standard line chart. There’s a ton of room for improvement but it fits my standard workflow of using SQL Workbench/J to execute the query and then quickly copy it over to my clipboard in a tab delimited format.
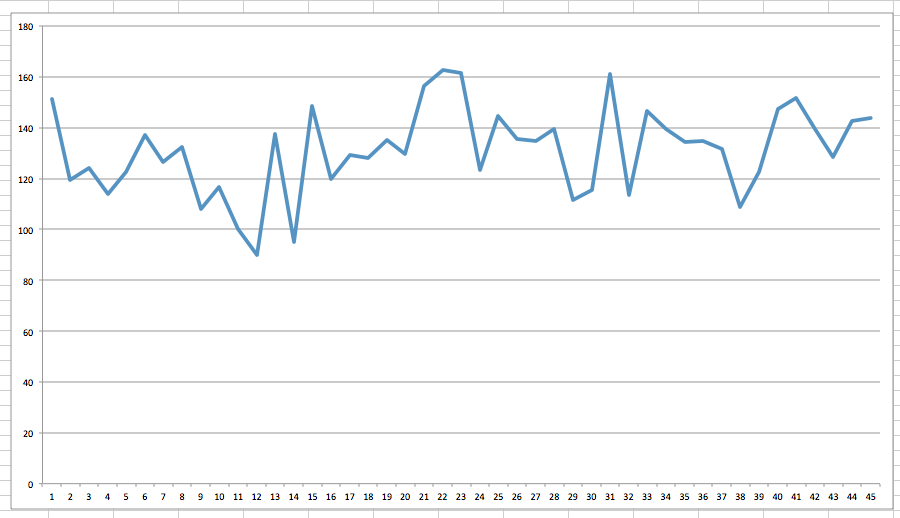
The code is up on GitHub and it can be executed from the command line by piping the raw data directly into the script. If the data is in the clipboard it’s as simple as typing in “pbpaste | ./plotter.py”. Using this approach I was able to generate the image below as well as the Excel version for comparison. The major improvements are cleaning up the styling so it looks nicer as well as supporting multiple series.