
As part of our data pipeline, we have a Redshift agg job that takes low level data and rolls it up to an hourly aggregate. A latter job takes the hourly data and rolls it up to a daily level which is used for high level reporting and summary statistics. Earlier this week we ran into a hiccup that caused some of these aggregate jobs to fail. After fixing the issue we had to figure out what data was affected and rerun it. We wrote a simple query to count the numbers of rows per day per hour in order to spot any gaps.
select ymd, hour, count(1) as cnt
from hourly_agg_table
where ymd >= '2015-04-01'
group by ymd, hour
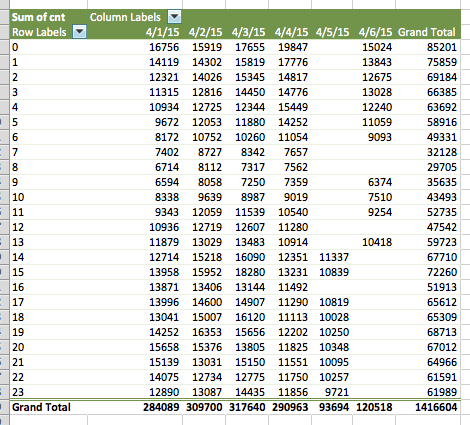
order by ymd, hour;This gave us a dataset with three columns that we wanted to then “pivot” in order to quickly spot the gaps. Using the pivot table functionality in Excel, it was simple to put date along one dimension and hour along the other to quickly spot the missing agg periods. All that was left was rerunning the job for those hours.
This investigation reminded me how important it is to be familiar with your tools and choose the right one for the job. Redshift and Excel are antithetical - Redshift is massively parallelizable and built for terabytes of data while Excel slows to a crawl when dealing with tens of thousands of rows. But by mixing them together we’re able to use each for what it’s best for: Redshift for very quick, large scale queries and Excel for the quick and dirty investigative work. This approach is useful in all sorts of problems - from mixing command line scripts with fleshed out programs to using a script or Excel to generate commands that you can then paste into the terminal or an editor. The key point is understanding your workflow and tools well enough to come up with an optimized process.