
Since writing the Drowning in JavaScript post I’ve been meaning to take a stab at automating that analysis and seeing if I could generate some other insights. This weekend I finally got around to writing a quick PhantomJS script to load the top 100 Alexa sites and capture each of the linked resources as well as their type. The resulting data set contains the time it took the entire page to load as well as the content type for each of the linked files. After loading these two datasets into R and doing a few simple transformations we can get some interesting results.
Average load time. To get a general sense of the data this plots the average time it took to load each URL. The interesting piece here is that multiple foreign sites take a while to load (163.com, qq.com, gmw.cn, ..) - I suspect a big reason is that there's quite a bit of latency since I'm based in the US. Another observation is that many news sites tended to load slowly (huffingpost.com, cnn.com, cnet.com). The Google sites loaded extremely quickly (all less than 1 sec) as did Wikipedia.
Load time boxplot. This provides a bit more information on the load times by showing the min/max values as well as the median and the percentiles. Not a significant amount of new insight here.
Number of requests. Huge variance here as well - rakuten.co.jp loaded almost 800 external files while the Google sites are all less than 10.
Number of request vs time to load. This leads to the question of whether sites that are loading more files take a longer time to load. By plotting a scatter plot between the two it's pretty clear that all things being equal more files increase page load time.
Number of requests vs time to load linear fit. A simple regression of load time as a function of the number of file requets confirms this. On average, each additional file leads to an additional 20 milliseconds of load.
File type frequency. We can also take a look at the most common type of file requested. As expected, images are the majority of requests followed by JavaScript.
File types by url. Not a lot of insight here but the colors sure are pretty. One thing that does standout is that if a site has a significant amount of file requests they tend to be of multiple types.
File type correlation. We can plot a simple correlation of file type found on a page to see whether there are any file types that tend to be included together. Not much going on here.
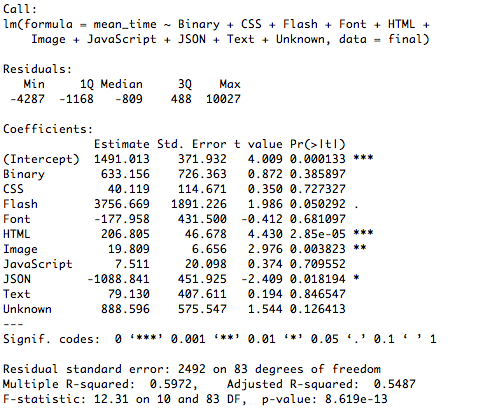
Multiple linear regression. And just for fun we can run a regression to see whether a particular file type leads to significantly worse load than others. I was hoping to show that having a lot of JavaScript hurts performance but that doesn't seem to be the case. I suspect it's due to the innate time differences it takes to load some sites (in particular sites outside the US) vs others.


As usual, the code’s up on GitHub.