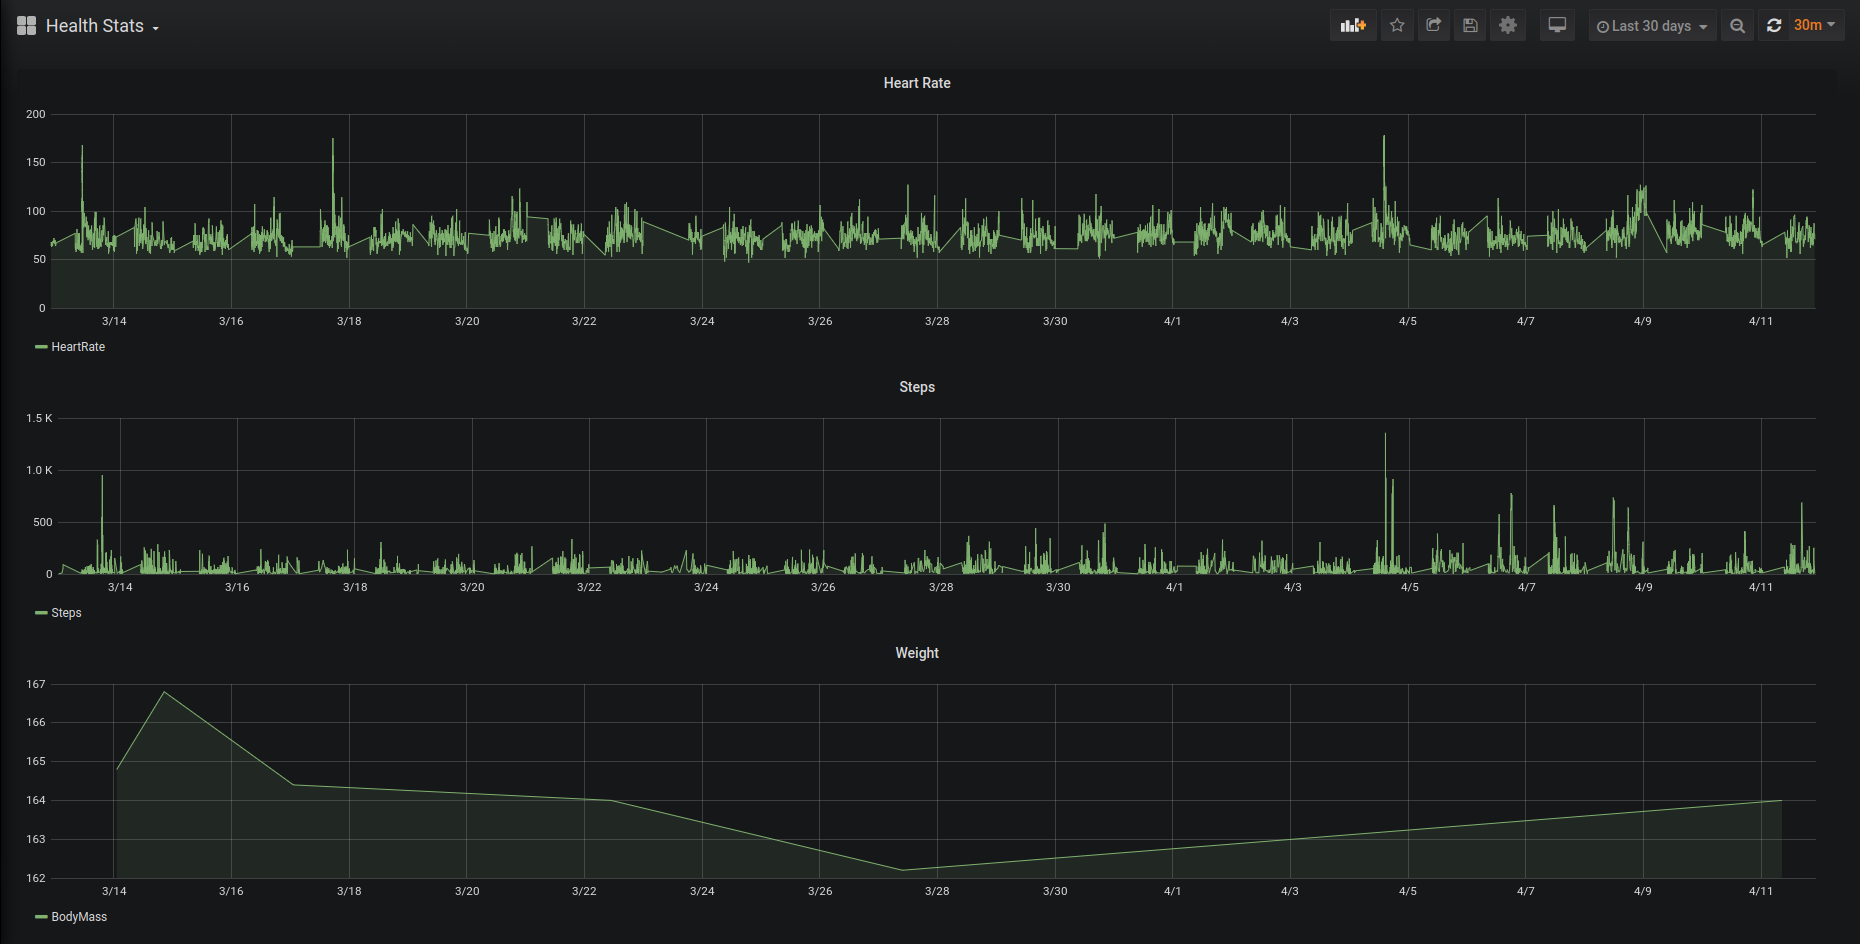
I apparently can’t get enough of Grafana and the latest quantified self push was to visualize the data from Apple health. Apple makes it pretty simple to export the data but it’s in XML so there’s a small bit of processing to turn into something that can be visualized. For my personal stats I’m dumping the data to MySQL and writing fairly simple queries to visualize them. Since I already did a similar export in my email-stats code I was able to reuse a fair amount. The major difference was that the Apple health export is fairly large (my export for 2020 was an 80 MB file) and it would be a shame to not apply a few optimizations.
In this case, I ended up doing two somewhat interesting things. One was to prevent duplicate information by making the code support some “since” logic which required the usual timezone wrangling that no one is able to escape. The other was adopting a streaming approach to both the iteration and filtration of the XML doc and the MySQL write. This ended up a pretty neat problem that showed off the power of Python’s generator since I was able to pass in the generator function itself into the database write method and then found a neat method that allowed me to fetch batches of data from the generator.
As usual, the code is up on GitHub but I’ve included the notable pieces below.
# From https://docs.python.org/3/library/itertools.html#recipes
def grouper(n, iterable, fillvalue=None):
    args = [iter(iterable)] * n
    return zip_longest(fillvalue=fillvalue, *args)

def read_records(fn, datetime_to_start = None):
    ...
    yield Record(TYPE_MAP[s.attributes['type'].value], dt.astimezone(pytz.UTC), val)

def save_records(creds, record_generator):
    ...
    sql = "INSERT INTO health_stats (type, datetime, value) VALUES (%s, %s, %s)"
    for batch in grouper(BATCH_SIZE, record_generator):
        vals = []
        for record in batch:
            if record is not None:
                vals.append((record.type, record.datetime, record.value))
        mycursor.executemany(sql, vals)

...

save_records(config['db'], read_records('export.xml', datetime_to_start))