In order to better understand myself, I’ve been collecting daily stats over the past few years with the idea that tracking various metrics would show me ways to improve. This happened to some degree - seeing many of the numbers leads to a sense of shame - but there hasn’t been a huge insight that looks at the interaction of the various items I track. To do that, I suspect I need to dive deeper into the quantified self movement and start continually tracking my physiological metrics rather than the current approach of a daily check-in describing my mood and what I consumed.
At least that’s the hope for 2020. For 2019, I modified an old script to help visualize the data I collected and while there’s not a huge amount that stood out there’s something about a whole year expressed through a series of data visualizations.

Around 7 hours of sleep a night with a pretty tight range. A few outliers but those are primarily data tracking issues when using Sleep Cycle and multiple sleep periods.

Week consumption of coffee, tea, alcohol, and coke (my primary soda) box plot.I'm pretty happy with the results. I'm consuming much less alcohol and soda than I used to and coffee is just under 2 cups a day.

I love my eggs for breakfast. Cheese is a close second.

A little bit more variety here than breakfast but still quite heavy on the chicken and salad. The sour cream is probably a surprise to many but as a Russian that's my salad condiment of choice. The beef burrito from the nearby burrito truck also makes an appearance in the top 10.

Dinner is surprisingly similar to lunch.

The unhealthiest of the meals. Goal for 2020 is reduce my sugar consumption.

Shows my drinking distribution. Coffee is up there as well as the various alcohols.

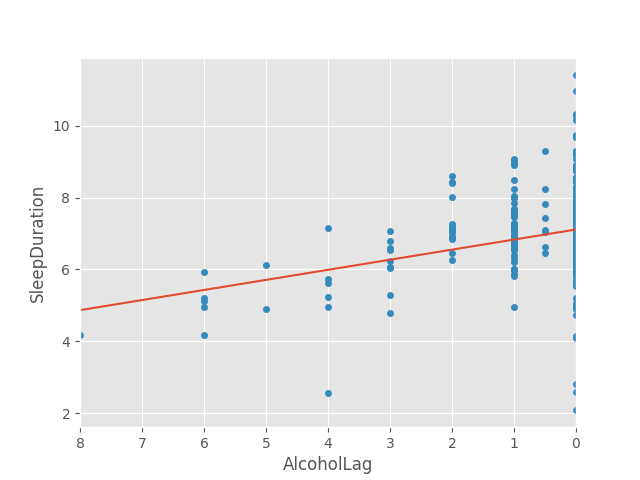
This is one of the more interesting ones but shows the relationship between my alcohol consumption and the subsequent amount of sleep. No surprise that the nights I don't drink I sleep more but the effect is pronounced.
