
GitHub sent me an alert this past weekend that a bunch of my repos were using old libraries that had security vulnerabilities. Nearly all of them were due to my usage of an old version of the requests library. Updating those was as simple as updating the requirements.txt file to the new version.
One of these repos, twitter-archive-analysis, is my most popular project on GitHub so I thought I might as well revisit it and see if I could both address the vulnerabilities and get it running again. Upgrading the packages was straightforward but there are very few things more humbling than looking at the code you’ve written years ago. Twitter changed the format of the archive from JSON to CSV since the last time I ran the code and as part of the upgrade I did a little bit of cleanup. The code is up on GitHub and I’ve included the visualizations it generated below highlighting my Twitter behavior over the years.
I tweet late in the evenings and nights.
Weekends, but especially Sundays, are my busiest Twitter time.
Not a ton here other than I haven't been tweeting as much recently.
Not much here but a cool visualization.
My tweets have gotten longer over the years but I'm still not hitting the 280 character limit.
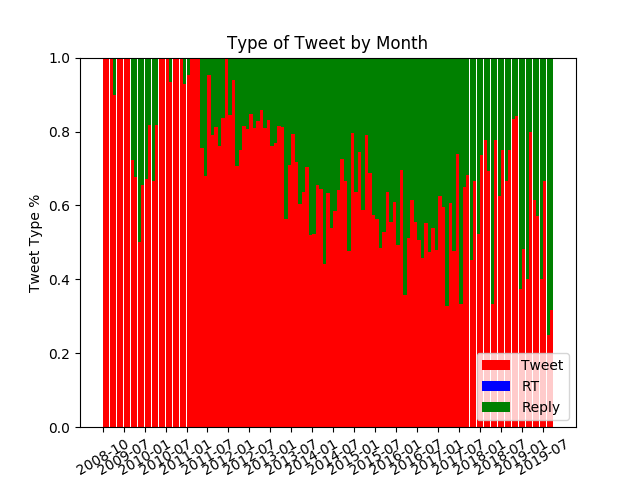
Tough to tell what's going on here but I'm trying to look at the ways I engage with Twitter over time.
This is a much nicer way of seeing that lately I've been much more about replying than tweeting.