
A hallmark of blogging is to do a year in review post with every blogger having their own distinct style. Some write about their tops posts, others about the lessons learned, some focus on the books read or places seen. I’ve been keeping meticulous daily stats around the hours slept, my physical and mental states over the course of a day, as well as the food, coffee, tea, soda, and alcohol consumed and the review is an opportunity for me to summarize and visualize this data. The goal is to identify healthy and unhealthy trends over time and use that information to make changes in my life. At the moment the stats are mostly high level summaries but what I want to do is use this data in order to identify hidden relationships in order to improve my physical state and mental moods. This is a work in progress but I hope to do more of that this coming year as well as improve the way I’m gathering this data. The analysis code is up on GitHub with a guide and a sample file that can be analyzed. And now on to the data:
Sleep duration box plot. Average of a little less than 7.5 hours but a decent range.
Daily consumption of coffee, tea, alcohol, and soda box plot. I'm happy with the soda consumption but disappointed with the coffee and alcohol. They are very close to last year's numbers and I wanted to reduce them both. Something I'm going to focus more on in 2017.
Weekly consumption of coffee, tea, alcohol, and soda box plot. Similar to the above but visualizing the data rolled up by week.
Breakfast wordcloud. It's not obvious how to analyze text so I figured a wordcloud was a decent attempt. I really need to avoid string cheese and move towards smoothies.
Lunch wordcloud. Clearly I love my Chipotle burrito bowl but need to veer away from it in 2017.
Dinner wordcloud. Looks as if dinner is the healthiest part of my day.
Snack wordcloud. This one is all over the place but string cheese is pretty dominant.
Alcohol wordcloud. I like my beer and wine with a pretty even split of white and red and a tiny bit of rose.
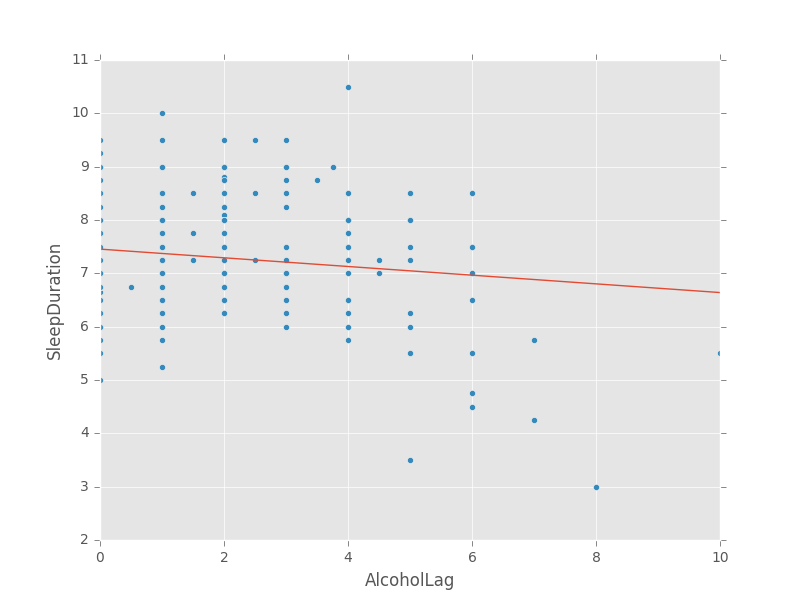
Alcohol (Lagged) vs Sleep Duration. This was an attempt to dig into a relationship I expected to be true: when I drink or go out I tend to sleep less. The intuition here is that I will stay up later if I'm out and will thus go to bed later. This holds pretty true although very statistically weak. Note that to do this I needed to shift the data by a day since my sleep duration is noted on the day that I woke up.