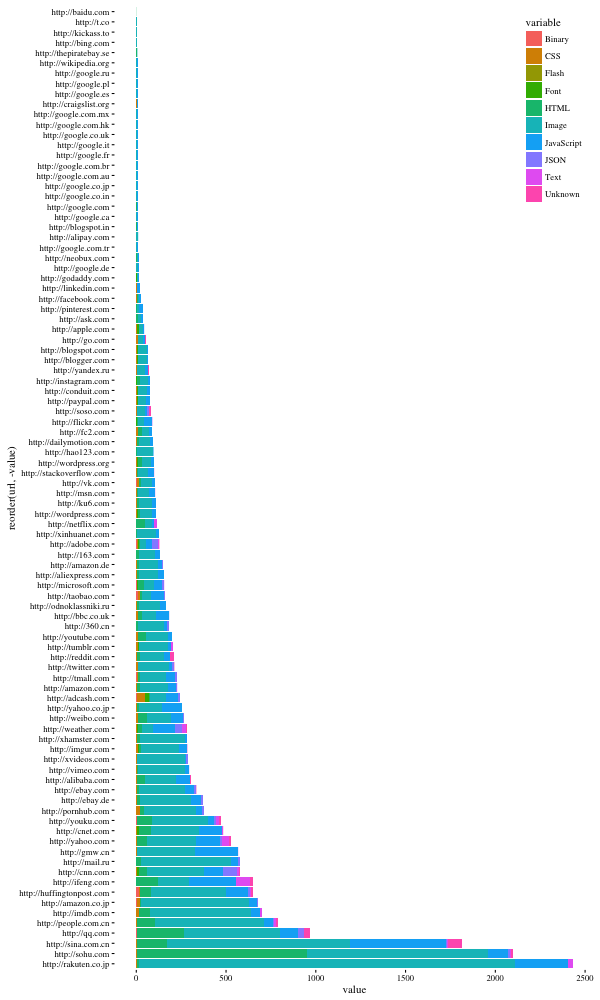
A few years ago I wrote a simple PhantomJS script to hit the top 100 Alexa domains and track how long it took to load as well as the types of requests it was making. The intent was to try to understand the different factors affecting site speed and how the different sites approached the problem. I rediscovered this script while digging through my old projects this week and thought it would be an interesting analysis to redo this analysis and see how it compared against the data from 2014. The general takeaway is that sites have gotten slower in 2016 compared to 2014 which is likely due to a significant increase in the number of requests they’re making.

Average load time. Pretty similar to last year with most of the top platform sites being incredibly quick. The surprising thing is that on average sites seem to have gotten slower but this can be entirely due to me having a different internet connection - something that on its own is an issue.

Load time boxplot. Similar distribution to two years ago but so much more variance. No idea why this would be the case.

Number of requests. Many more requests being made in 2016 than in 2014. In 2014 no site made over 1000 requests but in 2016 we see it happening with 3 sites.

Number of request vs time to load. Expected and similar results to 2014. The more requests a site is making the longer it takes to load.

File type frequency. Pretty similar distribution to 2014 but we do see much higher numbers across the board and a relative decrease in JavaScript and an increase in JSON and HTML.

File types by url. Not much here but seems that there's a bit more variety of content types compared to 2014 although still heavily dominated by images.
As usual, the code’s up on GitHub but you’ll need to go back in the revision history to get access to the old data files.

