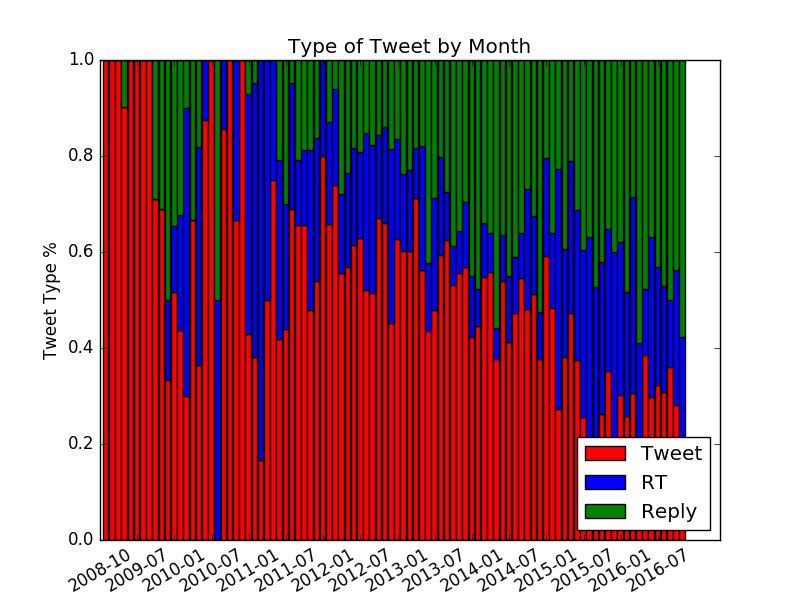
While going through my old GitHub repos I discovered that the most starred repo was twitter-archive-analysis, a Python script that would generate a view visualizations of a Twitter archive. I haven’t touched the code in over 3 years and decided to see how it was holding up and whether any of it still worked. After a few false starts getting the necessary packages playing nicely together and updating the code to support Twitter’s new archive format, I was able to get the old code working. Compared to three years ago, the results are surprisingly not that different - I definitely tweet less frequently than I used to and my activity has shifted into being more about replies rather than general tweets.

No tweets while I'm asleep but tend to be the most active in the evenings.

Pretty even distribution but more active on the weekends than the weekdays.

Hit my peak in 2013 and have been declining since.

I tried to get at the idea of how much I tweet over time and by day - the weekends have remianed steady but my weekday tweeting has dropped off.

Definitely not taking advantage of the full 140 characters.

The next visualization provides a much better idea of my tweet type distribution.

A clear trend to being more about replies and engagement rather than just posting thoughts and ideas.
