
I started actively blogging in 2013 and have been consistently writing 2 posts a week. There’s a ton of information here and I spent some time learning R all over again in order to analyze and visualize my blogging history. I started with a simple Python script that went through each post and dumped it into a CSV file with a series of columns that would be easy to analyze via R. The columns ranged from numeric stats - such as how many words, tags, images, and links - to the actual text of the post itself. The goal was to put in a structured enough shape that the rest of the analysis could be handled in R. I started by collecting some summary statistics and looking at them over time but got carried away and ended up digging deeper into my evolution as a blogger.
Some high level stats to start it off:
- 412 total posts with 54 of them before 2013
- 725 total links
- 537 total tags
- 1,379 total keywords
- 9,705 total words in the meta descriptions
- 145,499 total words of content
As mentioned I started actively blogging in 2013 so there's no surprise here.
Given that I've written the same number of posts in 2013, 2014, and 2015 it looks as if my posts have gotten shorter and shorter.
Similar to the point above - I'm sharing fewer and fewer links.
Yet I'm still tagging the posts at roughly the same rate. This makes sense since I'll do anywhere from 1 to 3 tags per post.
By month there's a bit more noise due to vacations but am keeping pace with 2 a week.
Nothing obvious here.
Just for fun but this is the total number of words by week. I also did this by day but it was even noisier.
Clearly I write more during the weekend. Note that I had to prepend a number to the day of week to get the sort working.
Similarly, the number of words is also higher on weekends.
Another way to look at it is to see the distribution by year. In 2013 I was actually pretty on-point with my Tuesday/Friday writing schedule but since then have regressed to mostly writing on the weekends.
The same information as above but switching the X and Y axes. I find this one not as easy to interpret as the previous one.
This examines the various companies I mentioned over time. Google's dominant and it looks as if I haven't written about microsoft since 2014. You can also see the rise of Uber and Snapchat.
Looks as if 2015 was the year of languages with Python and JavaScript dominating the others.
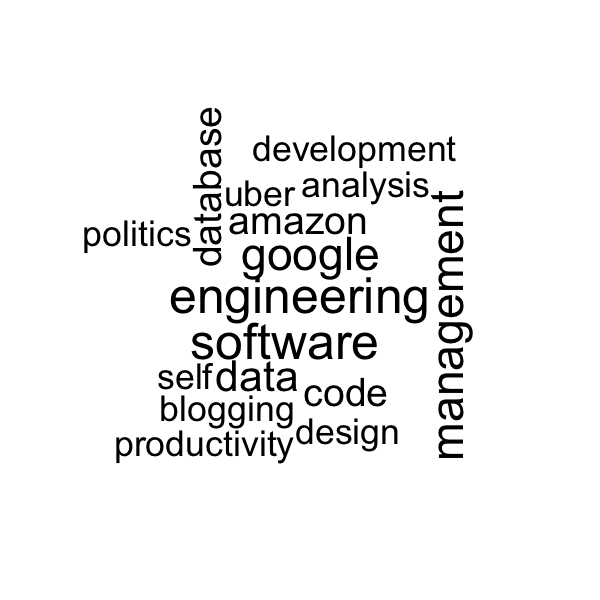
Word cloud of the various tags I used on my posts. Clearly I like engineering and startups.
Tag wordcloud for 2013. All about startups and design here.
Tag wordcloud for 2014. This gets deeper into technology with strong representation by AWS, devops, coding, as well as a variety of programming languages.
Tag wordcloud for 2015. Welcome to engineering management. In 2015 I developed into a manager and start writing about the various lessons I've learned on the journey.
Tag wordcloud for 2016. Nothing significant yet and looks like a pretty healthy mix of the prior years. We'll see how this looks after the year is over.