After discovering and browsing RelayRides I noticed that there were some users that had multiple cars available for rent. Clearly they weren’t using each of their cars and were using RelayRides exclusively as a revenue generating business rather than renting a car out when it wasn’t being used. This got me thinking about what the best car would be to rent on RelayRides if my goal was solely to maximize my return.
There were only a couple of factors at play here: the initial cost of the car, the price the car will rent at, and how often the car is rented. By combining these values we can come up with a ratio of car price to expected revenue per day. The challenge was in getting this data but it turned out to be surprisingly easy.
My first attempt was to simply scrape RelayRides but I ran into a variety of issues with the authentication process and not being able to evaluate JavaScript via a Python script so I switched gears. My second attempt was a lot simpler but got me what I wanted - after doing a search I opened the network tab in Google Chrome and examined the HTTP requests being made. One of these was to the /search endpoint which gave me a JSON feed of the 200 most relevant cars as well as their make, model, year, the daily rate, the listing time, as well as the total number of trips taken. All I needed to do was dump it into a file and start writing a quick script to start parsing and analyzing the data.

The next step was actually getting the price of a car. Once again I thought this would be a problem but it turns out the Edmunds API was perfect for this. It’s entirely free and amazingly worked in nearly all cases with the data I was able to get from RelayRides. The API was smart enough to take the make, model, and year from the RelayRides and provide an estimated price without any sort of data cleaning of transformation. The only issue I ran into was a few rate limiting errors when I decided to parallelize my script but the fix was to just introduce a delay between consecutive requests and retry if I ever encountered an issue.

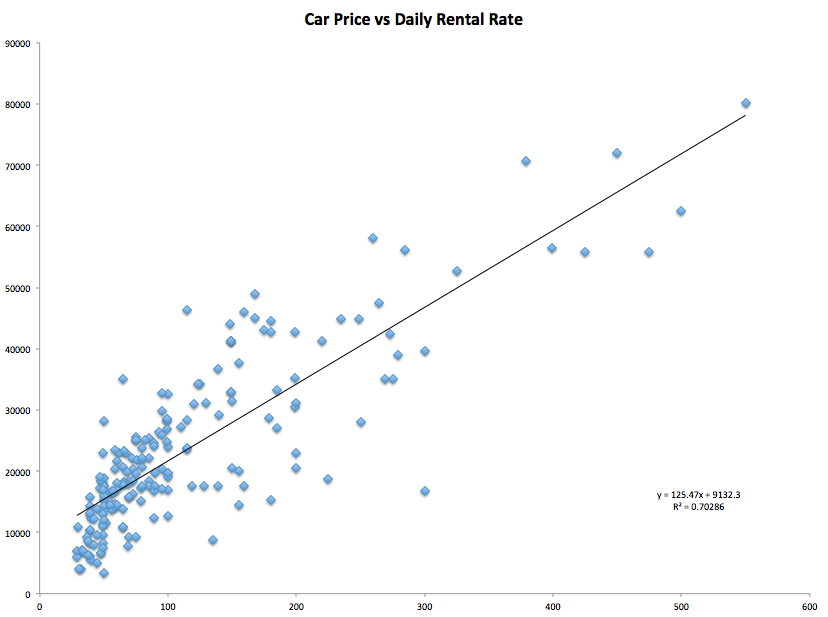
Combining the RelayRides data with the Edmunds API and doing some simple math gave me the answer I was looking for - a 2008 Toyota Prius. There were a few cars that had a better expected return but they also had very few trips taken and weren’t listed for long which leads me to believe that their return won’t last. For the most part, the rental rate ends up being highly correlated with the price of the car - the most expensive in my dataset was a 2011 Mercedes G-Class which is listed at a $550/day and has an estimated cost of $80k while the cheapest was a 2003 Ford Taurus that’s listed at $32/day and has an estimated cost of $4k. In general, the market seems pretty balanced in terms of price but there’s a wide variance in how often different cars get rented out - it’s clearly proportional to price but there’s definitely something else there. Unfortunately, this approach only lets us examine the cars that are actually listed and won’t let us predict how a random car would do. In the future I might take a stab at running a regression to generalize this approach but the challenge will be in figuring out the relevant factors.

As usual, the code’s up on GitHub and I’d love to hear ideas or thoughts on how to improve the code or the analysis.
