I’m an avid reader and signed up for Oyster as soon as I discovered them. Since then, every time I wanted to read a new book my first step has been to check Oyster. If the book wasn’t available I’d get it the old fashioned way and read it via Readmill, another great app.
One feature I wish Oyster had was the ability to see the overlap between their available collection and what I had in my “to read” list. The only way to do this now is to go through my list one book at a time and then search for it using the Oyster iOS app since the search functionality isn’t available via the web. Being lazy, I really didn’t want to do this and started searching for a quicker way. By browsing their website and looking at the network requests in Chrome I noticed two interesting API calls being made - one to get the book “sets” and another to get the books with a set.
These API endpoints turned out to be publicly accessible and it only took a short Python script to retrieve the books and dump them into a CSV file. This got me a little less than 3,000 books - turns out that the publicly accessible data is only a fraction of the entire collection and my endeavour wasn’t as fruitful as hoped.
I did manage to get a set of over 4,000 books and decided to have fun with it.

Num of authors by num of books written. Very few others appear more than once in the data set. This may be due to the limited data set or Oyster's job in editing the publicly accessible collections, maybe both.

Distribution of ratings. Ratings are clustered around 4 with very few ratings under 3. This is most likely a biased set since the Oyster editors would have chosen the highest rated books to be featured in their sets.

Num of books by author. Kurt Vonnegut has over 20 books available on Oyster with Shakespeare in the number 2 spot.

Ratings by author box plot. Just a quick box plot to see the rating distribution by author.

Rating vs # of books. Doesn't look as if the # of books an author has written on Oyster has any relationship with their rating. I thought maybe authors with higher average ratings would appear more frequently.

Rating over time by author. This was a reach but I wanted to see whether an author was most likely to have better ratings earlier or later in his or her career. In this case it looks as if the publish date isn't the original authorship date so not a very useful analysis.

Publisher ratings. Similar to authors, we can take a look to see whether some publishers have significantl higher ratings than others. This is a bit more useful since there's a lot more data per publisher than there is per author. I couldn't make much sense of the results here.

Avg number of pages by decade. I wanted to see whether books were getting longer or shorter so did a quick plot of the average number of published pages by decade since the year was too fine. The publish dates aren't entirely accurate so I wouldn't read too much into this.

Avg rating by decade. Similar to the previous plot but looking at the average rating rather than the number of pages. Seems to be pretty steady to me although this may be due to the dataset being a curated list of top books.

Rating vs date. Another way to look at the previous plot but plotting each book rather than the average by decade. Not much going on here although this may be due to the biased dataset and flawed publish dates.

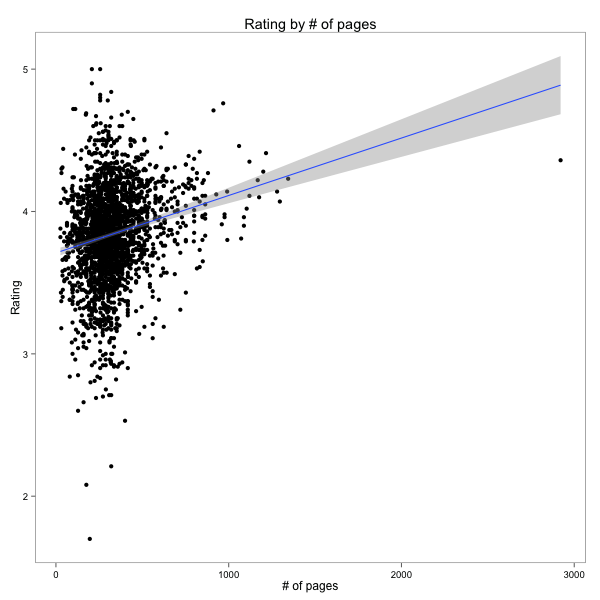
Rating vs number of pages. This is an interesting one - are longer books more popular? Most of the books are clustered around a couple of hundred pages but longer books do tend to have a higher average rating. I'm not sure why this would be the case but would guess that only someone who's already interested in a long book would read it or stick with it enough to leave a review.
As usual, the code’s up on GitHub.

