
Over the weekend I wrote a quick script to crawl the top 100 Alexa sites and compare them against one another in terms of load times and resources being loaded. I shared my code on GitHub and earlier today I got a great pull request from rahimnathwani who ran the script in Beijing, using home ADSL, and wanted to share his dataset.
I suspected that that many sites were loading slowly for me due to my geographical distance from them and with this dataset we’re able to compare the load times between NYC and Beijing for these sites. Unsurprisingly, most sites in Asia do load faster in Beijing but the average load time is much longer, 3.4 seconds in NYC vs 11 seconds in Beijing. A surprise was how slowly rakuten.co.jp loaded in Beijing - over 50 seconds on average and I suspect this is due to the huge number of images being loaded. I suspect internet speeds also played a part in the differences here so this isn’t a perfect comparison.
Below are some visualizations highlighting the differences in a few different ways. I’d love to get my hands on more data so if fee free to submit a pull request with your data and I’ll rerun the analysis. I’ve also included the R code that generate the plots below for those curious to see how they were done.
Parallel plot. The idea here is to see whether the lines are mostly horizontal or if they're steep. Horizontal lines would indicate that sites are universally slow (and fast) while steep lines indicate that some sites load much faster in one city compared to the other.
Load time differences. Here we sort the sites by the difference in average load time, NYC minus Beijing. Most of the sites loaded faster in NYC but I suspect the biggest reason was due to internet speed differences. The sites that loaded faster in Beijing are for the most part in China.
Scatter plot. A different perspective than the parallel plot but trying to answer the same question. We do notice a few outliers here which we can investigate by adding text labels.
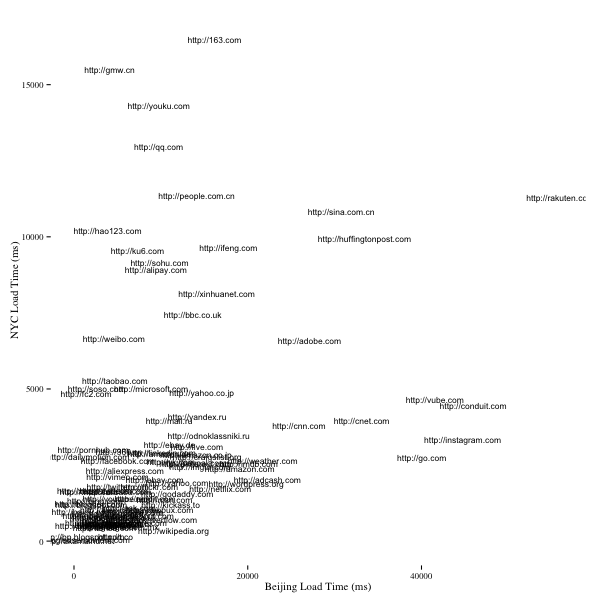
Labeled scatter plot. This provides a nice look at the outliers but makes it impossible to look at the sites that loaded quickly in both NYC and Beijing.


times <- read.csv("out-times-beijing.csv", sep="\t", col.names=c("url", "time"))
times$url <- as.character(times$url)
final <- ddply(times,~url,summarise,mean_time_beijing=mean(time),sd_time_beijing=sd(time))

times2 <- read.csv("out-times.csv", sep="\t", col.names=c("url", "time"))
times2$url <- as.character(times2$url)
final2 <- ddply(times2,~url,summarise,mean_time_nyc=mean(time),sd_time_nyc=sd(time))

combined <- merge(final,final2,by="url")
combined$time_diff <- combined$mean_time_nyc - combined$mean_time_beijing
combined.m <- melt(combined, id.vars=c('url'), measure.vars=c('mean_time_beijing', 'mean_time_nyc'))

png('crawl-stats-comparison-parallel.png', width=600, height=600)
ggplot(combined.m) +
  geom_line(aes(x = variable, y = value, group = url)) +
  theme_tufte() +
  ylab("Load Time (ms)") + xlab("")
dev.off()

png('crawl-stats-comparison-time-diff-bar.png', width=600, height=600)
ggplot(combined, aes(x=reorder(url, -time_diff), y=time_diff)) +
  geom_bar() +
  theme_tufte() +
  coord_flip() +
  xlab("Load Time Diff (ms)") +
  ylab("URL")
dev.off()

png('crawl-stats-comparison-scatter.png', width=600, height=600)
ggplot(combined, aes(x=mean_time_beijing, y=mean_time_nyc)) +
  geom_point() +
  theme_tufte() +
  xlab("Beijing Load Time (ms)") +
  ylab("NYC Load Time (ms)")
dev.off()

png('crawl-stats-comparison-scatter-text.png', width=600, height=600)
ggplot(combined, aes(x=mean_time_beijing, y=mean_time_nyc)) +
  geom_text(aes(label=url), size=3) +
  theme_tufte() +
  xlab("Beijing Load Time (ms)") +
  ylab("NYC Load Time (ms)")
dev.off()